
On May 1, 2023, First Republic Bank (FRB), headquartered in San Francisco, became the third bank to fail this year. Silicon Valley Bank (SVB) and Signature Bank failed earlier this year; and Silvergate Bank, which was closely tied to the U.S. crypto economy, liquidated itself and is not listed by the FDIC as a bank failure. Most of FRB was sold to JPMorgan Chase, the largest bank in the nation. Deposits were protected and customers experienced uninterrupted service through the acquisition.
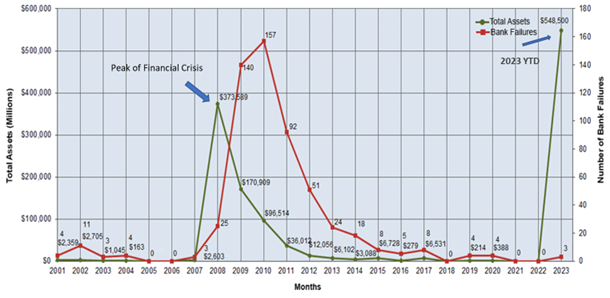
Although the number of bank failures this year is not particularly alarming, with $212 Billion in assets, the failure of FRB is the second largest in history, behind the 2008 failure of Washington Mutual Bank ($307 Billion in assets). The other failures this year were also large institutions, which again is significant. The graph below from the FDIC illustrates this. The green line shows total assets of failed institutions and the red line, the number of institutions. As shown, the total assets of failed institutions for the year are higher than at the peak of the financial crisis in 2008.
There were some commonalities among the institutions that have failed this year. All three banks had large amounts of uninsured deposits. In Mid-March after the other banks collapsed, S&P Global Market Intelligence analyzed U.S. Banks with at least $50 billion in assets as of December 2022 and estimated that 67.4% of deposits at FRB were above the $250,000 limit for FDIC insurance[1]. SVB had the highest share at 93.8%, Signature Bank ranked fourth at 89.3%, and FRB ranked tenth in the analysis of uninsured deposits. This obviously made all three vulnerable to a run on deposits.
Early Warning Signs
There were early warning signals that FRB was in trouble. The Bank had faced multiple credit rating downgrades due to concern over funding and liquidity. Rating agencies viewed the high level of uninsured depositors as a source of risk especially in the event of a panic-inducing crisis. Additionally, in December, 61% of the Bank’s book value of its investment portfolio was in municipal securities – a high concentration by industry standards. The credit quality of these assets was considered good, but their returns and lack of liquidity was a concern.
We discuss more details and series of events below that led up to the failure of FRB, but surprisingly, the source of the issues in large part lies simply in the business model itself.
The Bank specialized in offering individualized banking services to the wealthy, which included low-cost credit offerings to affluent customers. This strategy is conducive to building assets, favorable with respect to credit quality, and seems like a sound strategy from a strictly business-oriented approach. Most banks have at least some component of their resources dedicated to this segment of the credit market. This approach worked when interest rates were low but quickly became problematic when rates began to rise.
The Bank’s low-yielding asset base lowered income and made it difficult to keep up with the higher rates other institutions were paying for deposits. This had a cascading effect, as more attractive yields were available to their customers who began seeking higher returns elsewhere. As deposits dropped, confidence in the Bank began to erode. When the first two banks failed, panic set in and confidence evaporated as illustrated by Figure 1.
Diving Deeper
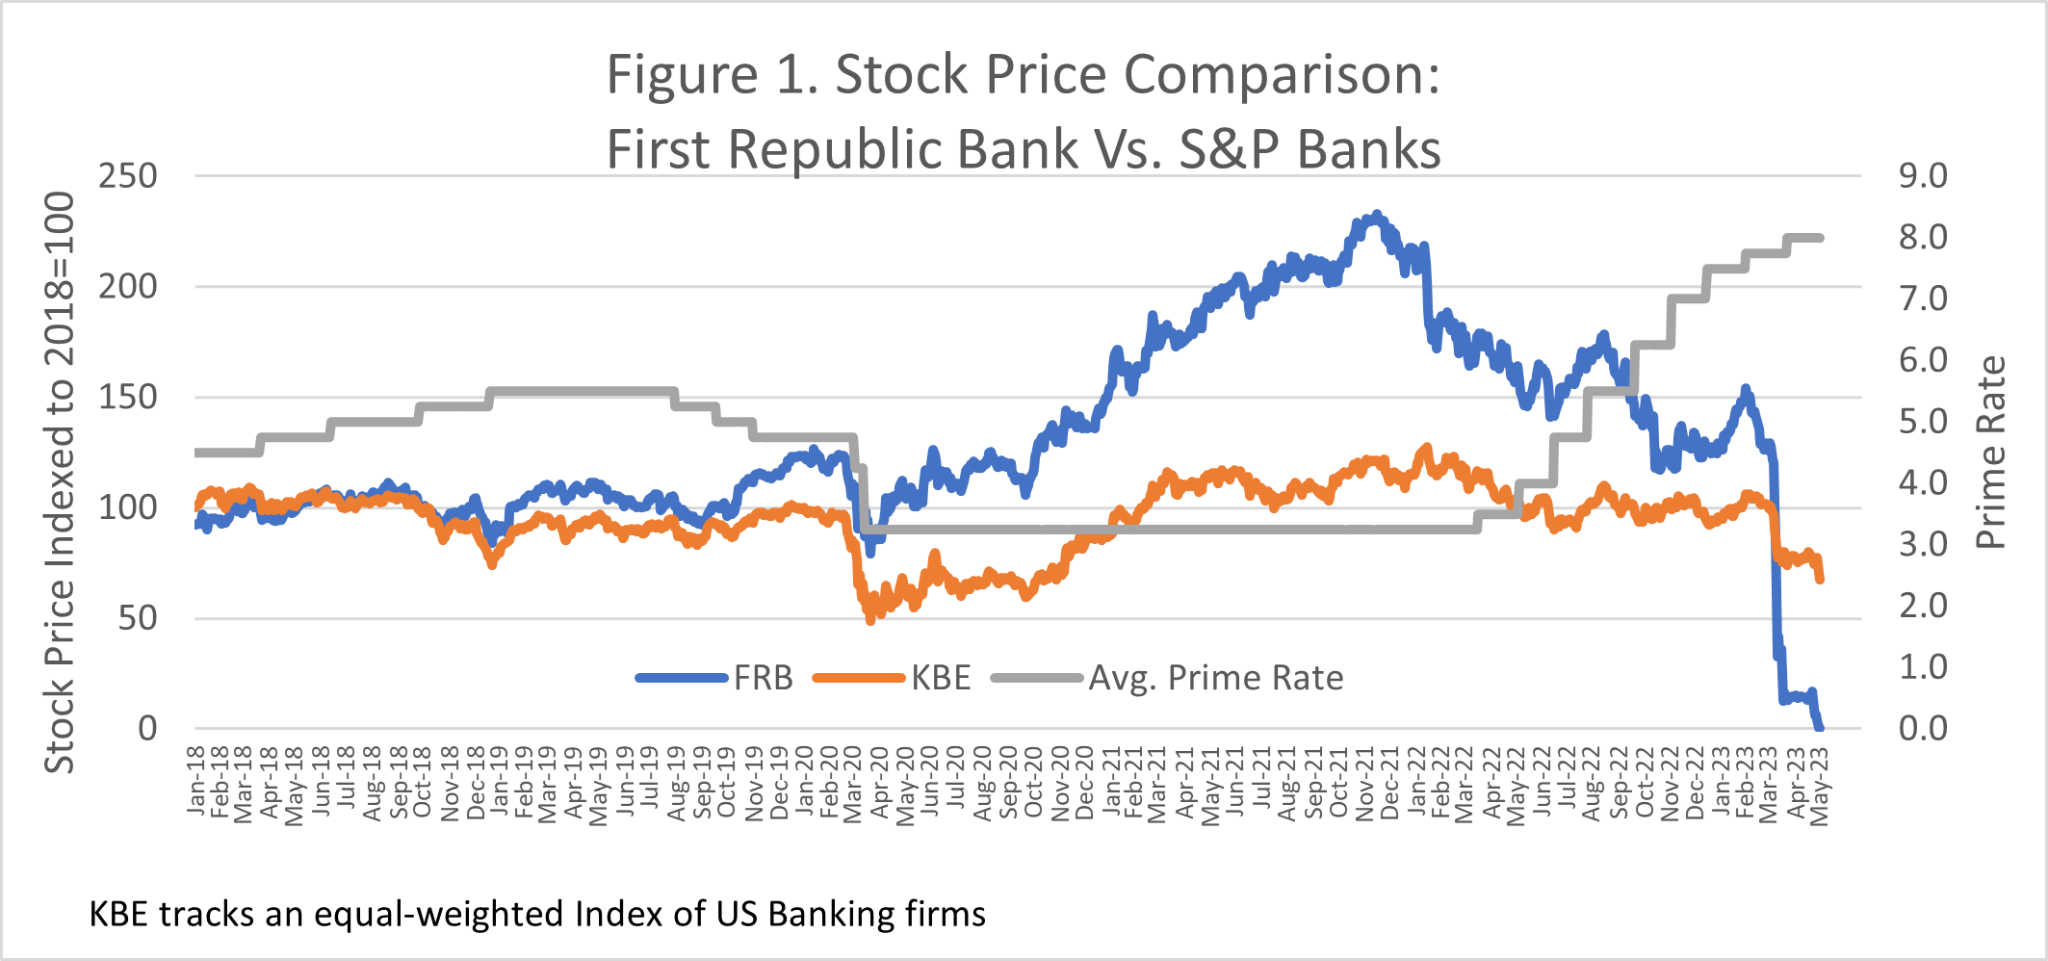
Figure 1 shows stock prices for FRB and an index of S&P banks. Both series are indexed to 2018 prices so that a comparison of relative price performance can be displayed.
Again, when interest rates remained low, the stock price at FRB out performed other banks. As interest rates rose, confidence began to wane with the stock price down 40% in 2022 from the prior year. Once SVB and Signature Bank were shuttered, the impact on FRB was evident. Despite borrowing heavily from the Federal Reserve and the Federal Home Loan Bank Board as well as a cash infusion of $30 Billion from a consortium of 11 banks, First Republic was not able to remain solvent.
There were also warning signs in some of the commonly used financial measures.[2] Figure 2 compares the efficiency ratio of FRB to all FDIC insured Institutions.
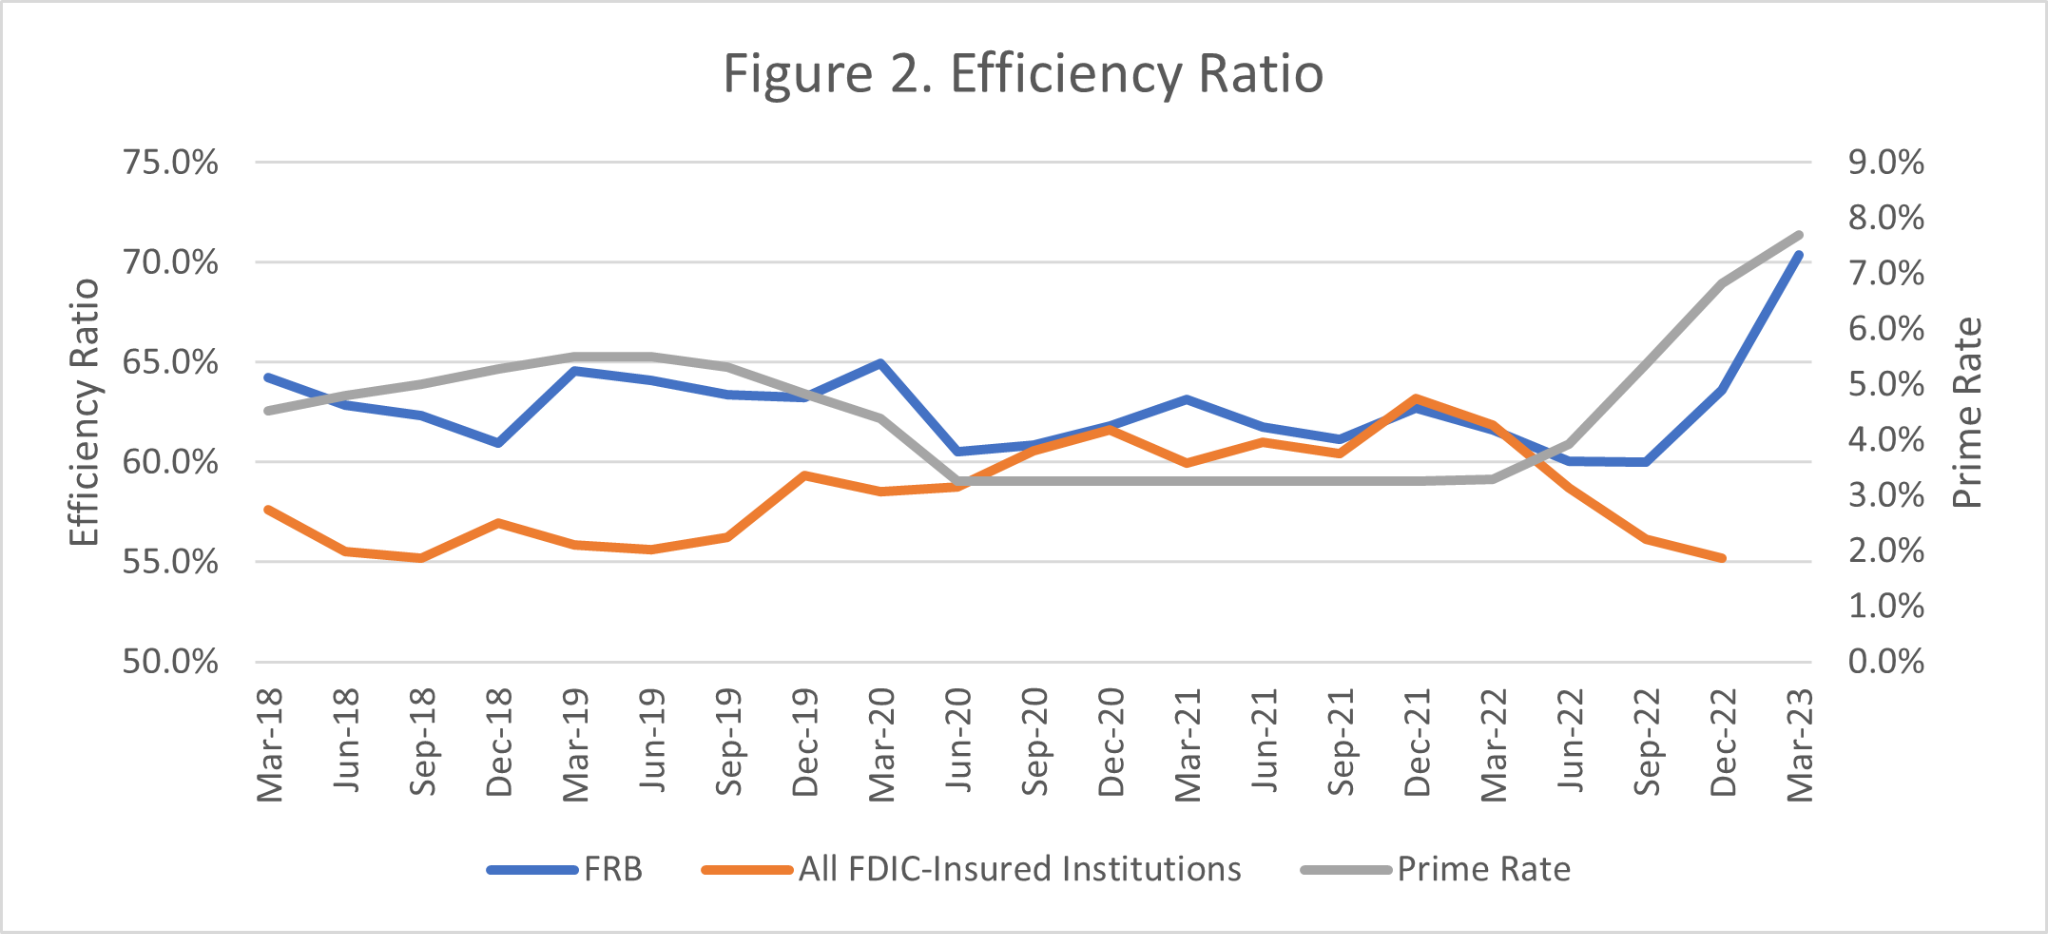
The efficiency ratio is a measure of non-interest operating cost to net interest income.
Generally larger banks have lower ratios due to their diversified income base. As figure 2 reveals, FRB had a relatively high efficiency ratio, which began to rise sharply toward the end of 2022. This indicates a low rate of return on assets.
While larger banks tend to have a diversified loan base, FRB was highly concentrated in low yielding fixed rate mortgages due to the focus on the affluent customers. The Wall Street Journal reported that in 2022 more than half of the Bank’s loans were residential mortgages with an average interest rate of 2.89%.[3] This set up the classic interest rate-risk scenario that doomed the Savings and Loan industry in the 1970’s.
Some banks offset low interest income through fees such as transaction fees, insufficient funds fees, monthly account service charges, inactivity fees, and so on. FRB’s focus on wealthy clients meant fees were low. Over the past five years FRB’s ratio of noninterest income to average asset was consistently around 38% of the ratio for all FDIC insured institutions. Thus, there was no additional income to offset the low rate of return on assets.
Figure 3 shows the net loans and leases to deposits for FRB and all FDIC insured institutions.
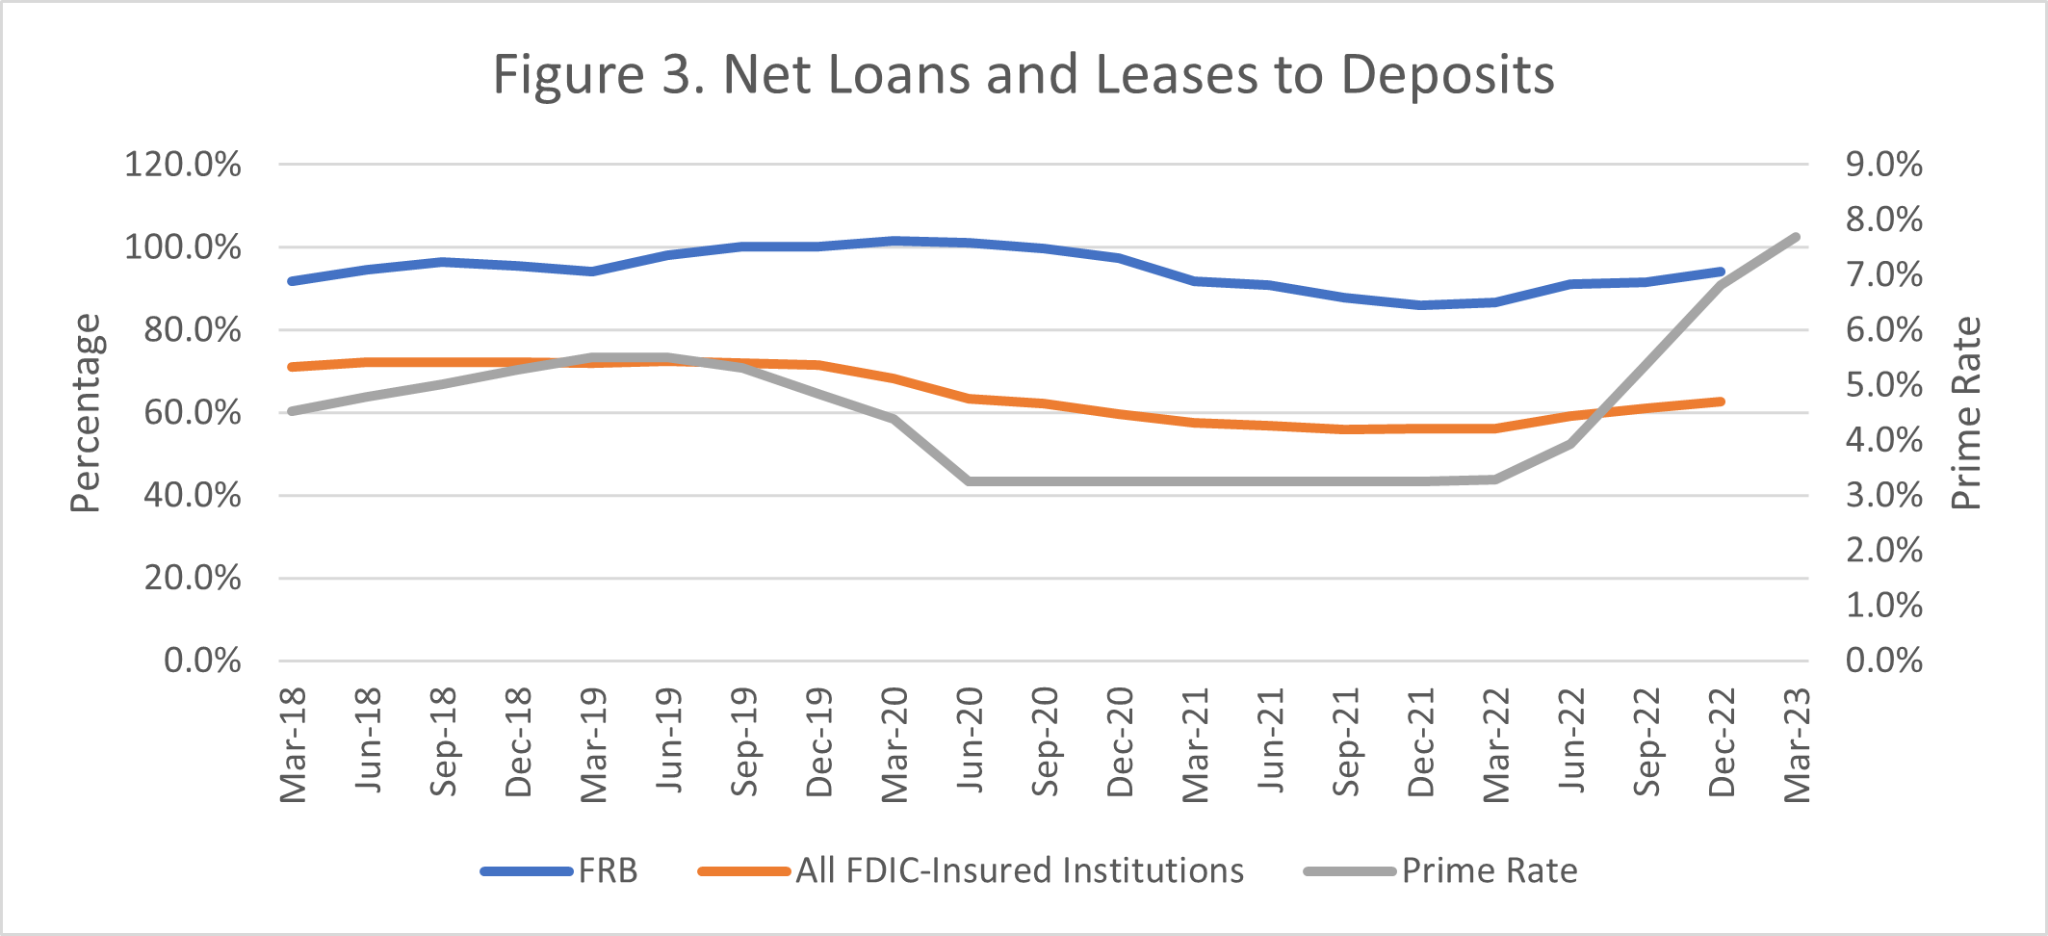
As shown, FRB had a much higher than average LTD ratio. Banks are typically between 80% and 90%, and FRB had routinely gone over 90% over the past few years and went above 100% during COVID. The Bank’s LTD ratio was trending down following COVID and reached 80-90% before interest rates began to rise. As depositors shifted money elsewhere, the LTD ratio rose and was over 94% by the fourth quarter of 2022.
This is further evident in the net interest margin (NIM) illustrated in Figure 4.
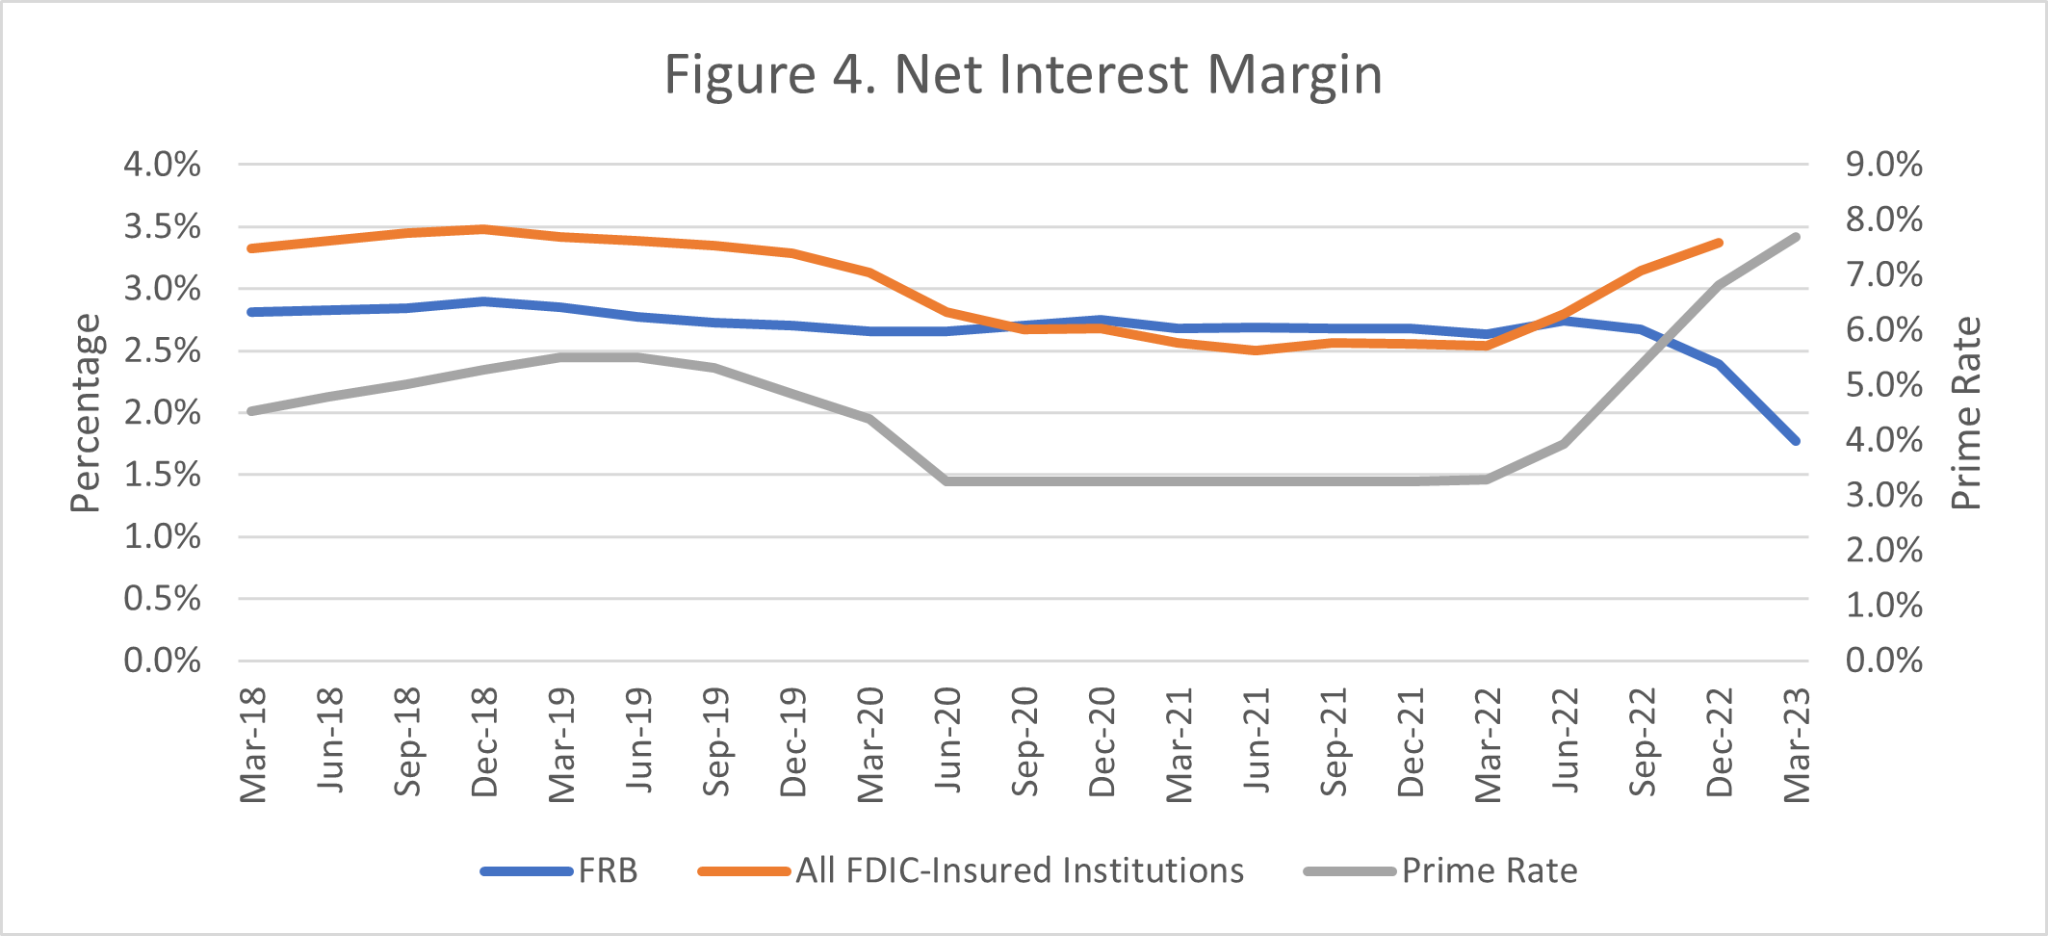
The NIM measures the difference between interest paid and interest income, after adjusting for the total amount of interest generating assets held by the bank.
In the 2018-2019 period, the average NIM across all FDIC insured institutions was 3.4%. At FRB, the average was significantly lower at 2.8% reflecting the downward pressure on net income. The Bank’s press release announcing the financial results for the first quarter showed the NIM had plummeted to 1.77% from 2.45 in the prior quarter. According to the Bank, “The decrease was primarily due to higher short-term borrowings, which was partially offset by the impact of CD withdrawal penalties that increased the net interest margin by 11 basis points.”[4]
What We Can Learn
A few key points can be gleaned from this analysis. We pointed out in an earlier post that managing credit quality alone is insufficient for banks to maintain viability. The demise of FRB is a clear example of that point, as their loan losses were extraordinarily low. Credit quality was clearly not an issue here.
Secondly, the business model of catering to an affluent customer base and relying on low-cost, low-yielding credit products as the primary source of income led to poor management of interest rate risk on both the asset and liability side. This was the chief contributor to the failure.
Although no one could (or DID for that matter) predict the impact of COVID on the credit market or anticipate the recent precipitous rise in interest rates, at some level this is more of a “classic” bank failure rather than a unique situation.
At the same time, however, it does suggest a degree of risk the affluent-customer model may present in the current financial market, especially when not diversified. We have written about this in previous posts from the standpoint of fair lending risk, but while good from the standpoint of credit quality, there are obviously other potentially systemic risks that should be considered.
[1] Hayes, D. (2023, March 14). “SVB, Signature Racked up Some High Rates of Uninsured Deposits.” S&P Global Market Intelligence https://www.spglobal.com/marketintelligence/en/news-insights/latest-news-headlines/svb-signature-racked-up-some-high-rates-of-uninsured-deposits-74747639. [2] The bank level data examined are mostly from the FDIC but have been supplemented with the bank’s press release on April 24, 2023 which disclosed their financial results for the first quarter. The prime rate data are from the Fed. [3] Ensign, R. L., Brown, E., Andriotis A.M. and Heeb, G. (2023, May 1). Why First Republic Bank Collapsed. Wall Street Journal. https://www.wsj.com/articles/first-republic-bank-collapse-why-banking-crisis-61660d96 [4] First Republic Bank. (2023, April 24, 2023). First Republic Reports First Quarter 2023 Results [Press Release]. https://ir.firstrepublic.com/static-files/013f57fb-b980-4353-bbb3-0e7a3b27f20a

Dr. Darrin Webb joined Premier Insights in September 2020 as Senior Economist, Macroeconomics and Forecasting. As the former State Economist for the State of Mississippi, Dr. Webb is a recognized expert in macroeconomics and forecasting. At Premier, Dr. Webb is leading the effort to more comprehensively and precisely address the qualitative component of CECL. Dr. Webb earned his PhD in Applied Economics from Clemson University.