
In a recent post we highlighted the increases in aggregate HMDA lending between 2021 and 2022 in majority-minority census tracts (MMCT’s) as reflected in the preliminary public HMDA data recently released by the CFPB.
Of the 412 Metropolitan Statistical Areas (MSA’s) as designated by the Office of Management and Budget (OMB), 75% reflected at least some increase in MMCT’s, with an average overall increase of roughly 5% across all MSA’s in terms of loan originations.
Much of these increases are attributable to the changes in census tract delineations between 2021 and 2022. In 2021, lenders reported HMDA data based on 2010 Decennial Census boundaries. In 2022, lenders submitted data based on 2020 Decennial Census boundaries. Nationwide, roughly 1/3 of the boundaries changed between censuses along with the population proportions; thus, the designations with respect to minority statuses of the tracts changed accordingly. A large portion of the increases in MMCT’s are due to the boundary reclassifications rather than “true” year-over-year increases in majority-minority geographies.
Borrowers vs Geographies
However, further examination of the data indicates that there were also increases in HMDA reportable loans to minority borrowers during this time period. These data are unrelated to the tract boundaries and, therefore, represent true year-over-year increases in the share of total loans to these groups.
Again, examining the data at the MSA level, and defining minority borrowers as either black or Hispanic, 385 of the 412 MSA’s (93%) saw at least some increase in the proportion of loans to black or Hispanic borrowers.
The overall average across all MSA’s was a 1.6 percentage point increase in the share of all loan originations, with the highest being 7.6 percentage points (Grand Island, NE). There were 7 MSA’s that had a year-over-year increase of 5 percentage points or more, and 59 had an increase of 3 percentage points or more. The top 25 MSA’s reflecting the largest increases are shown in the table below.

Explaining the Change
There are a number of factors possibly at work that may account for these changes.
The growing minority population is at least in part a contributing factor. Regulatory pressures may also have some influence. As an example, Memphis appears in the top 5 in terms of increases to minority borrowers and in the top 10 with respect to majority-minority geographies. Memphis is the location of two recent fair lending enforcement actions in which the remediation included loan subsidies and other efforts in majority-minority geographies and to minority individuals and specifically, black and Hispanic borrowers.
These factors aside, the potentially greatest contributing factor is the interest rate environment over these years. Rates dropped to historic lows in 2020 during the COVID crisis and remained there through 2021. However, rates began rising sharply in 2022 and have continued to rise since. This obviously dampened loan demand, but another trend to be noted during a rising rate environment is the composition of the credit market.
In other words, how does this affect the distribution of the borrowers?
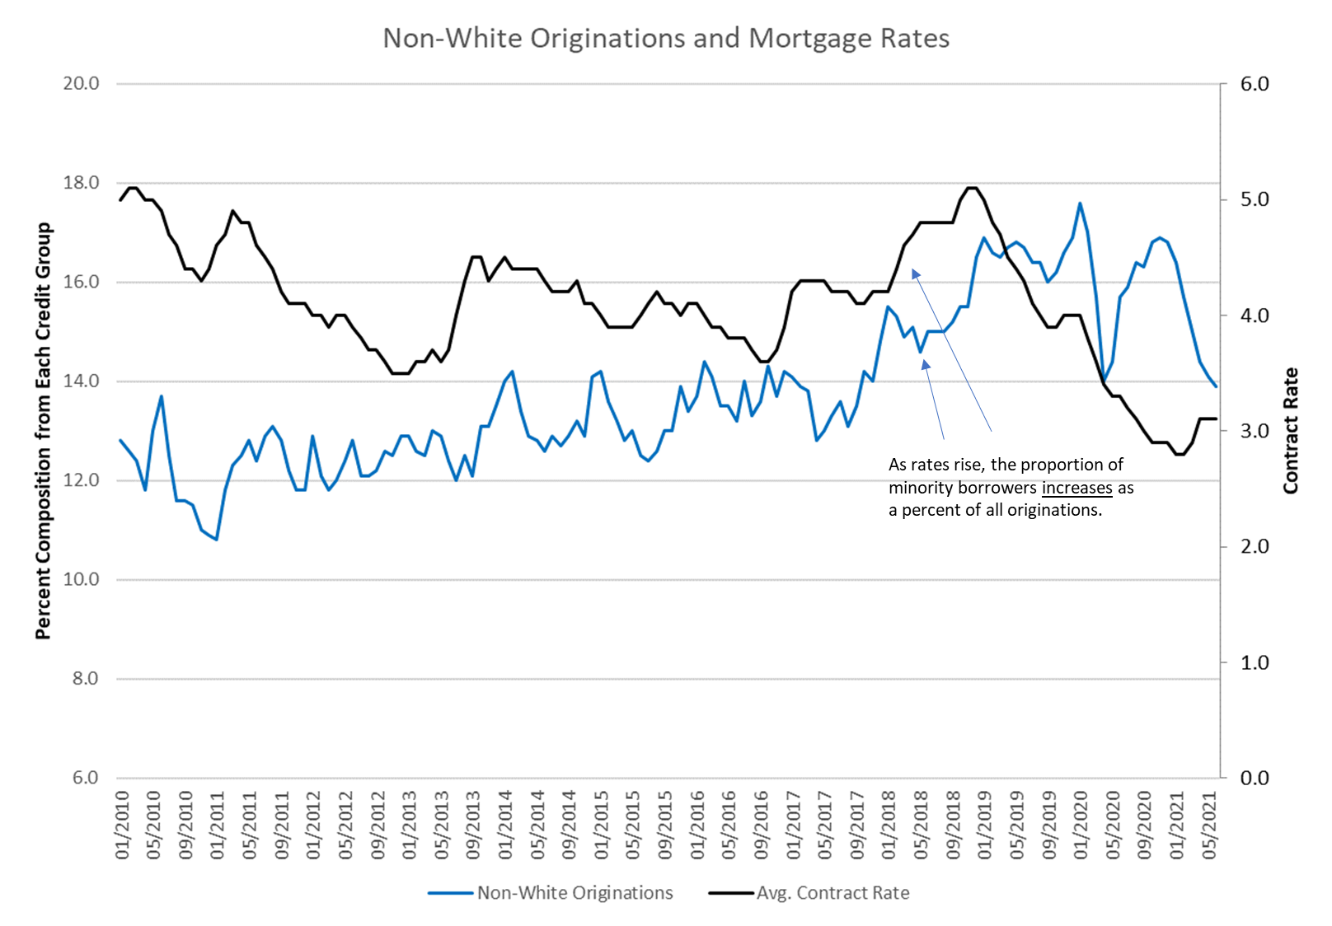
Analyzing data from the Federal Housing Finance Agency and the rate environment, the data clearly indicates that historically, in a rising interest rate environment, the share of minority borrowers increases relative to white, non-Hispanic borrowers. The share of white, non-Hispanic borrowers accordingly decreases. This is shown in the graph below.
This has implications for lenders with respect to managing fair lending risk.
Managing the Risk With the Rate
For example, with respect to redlining tracking and assessing the share of loans to minority borrowers, lenders are generally measured against peer benchmarks. Since current year peer data is not available, lenders typically rely on previous years by which to set their thresholds. In a rising rate environment, these numbers may have a tendency to be higher than expected. This should be a consideration in goal setting for equitable lending with respect to lending data and in particular, HMDA data.
In addition, if the share of minority borrowers increases, and there are products that have strict underwriting standards that may have a tendency to exclude minority individuals from approval due to stringent credit requirements, this may increase disparities between protected and non-protected borrowers.
This would be further augmented by a smaller number of non-protected applicants that may be of higher credit quality, thus lowering the denial rate for this group which would further widen these disparities – increasing fair lending risk.
Aside from the credit market with respect to the borrowers themselves, a rising rate environment also imposes greater fair lending pricing risk. In a compressed rate environment, there is little variation in rates that are charged and, therefore, fair lending risk is lower. In a rising rate environment, or one in which the rates are higher, there is more variation in rates that are charged and, therefore, more risk. Although rates are not necessarily at historic highs currently, they are higher than they have been in over a decade.
Fair lending risk should always be evaluated against the backdrop of the credit and economic environment, as both can yield key indicators of hidden and/or imminent risks. These are important considerations for fair lending risk management and should be part of a lender’s fair lending risk-management planning.