Between Covid-19, multiple hurricanes, social unrest, and Murder Hornets, the year 2020 has been strange, if not bizarre, to say the least. The year has also been “interesting” when it comes to the economy. Today we will discuss where we are and what we might expect in the coming months.
Defining Terms
The National Bureau of Economic Research (NBER) is the agency tasked with officially dating peaks and troughs of the business cycle – i.e. dating recessions. The business cycle is usually expressed in terms of real gross domestic product (GDP) [1]. A “peak” in the business cycle occurs when real GDP reaches its highest point before a contraction begins. A “trough” represents the lowest point before an expansion begins.
On June 8, the NBER declared February 2020 as the end point of the longest running expansion in U.S. history. It lasted 128 months. This designation means that the nation officially entered a recession in March 2020. The 2020 recession is unlike any other recession in the history of the U.S. in that it was essentially self-imposed. We effectively slammed on the breaks of the economy in order to combat COVID-19. NBER has not officially declared the end of the recession, but most economists believe recovery began in May, making the COVID-19 recession the shortest on record.
Overview of Current Situation
Although short-lived, recovery is likely to be slow for at least three reasons: (1) the depth/breadth of the recession, (2) lingering effects from supply chain disruptions and (3) ongoing risks of COVID-19 infections. Economists believe we will not return to pre-recession levels of GDP until late 2021 and that is contingent on a vaccine being developed by mid-2021. Full recovery of employment will likely take longer as businesses tend to take a wait-and-see approach to hiring. The threat of COVID-19 infections will only add to this cautious approach and prolong the jobs recovery. In fact, the data suggests that the pace of improvement in the overall economy has slowed since midsummer as infection rates have risen and stimulus efforts have dissipated.
Fast & Furious
Just how deep was this recession? According to the Bureau of Economic Analysis (BEA) Real GDP peaked in the fourth quarter of 2019. The latest estimate for the second quarter shows a peak-to-trough decline of 10.1%. In the “Great Recession” of 2008, which was the worst recession since the Great Depression, the Nation experienced a peak-to-trough decline of 4.0%. It is worth noting that the 2008 decline took place over six quarters whereas the Covid-19 Recession took place over two with the largest portion of the decline occurring over a matter of weeks. The Covid-19 Recession was fast and furious!
Who has been Affected?
The recession was broad-based with nearly every sector and every country’s economies impacted to some degree. With governments across the globe ordering various forms of a lockdown, supply chains have been drastically impacted. This means that even for a company attempting to maintain operations, essential inputs or components may not have been available. In some places, getting employees back to work after lockdowns have been lifted has proven challenging. Those ordering goods online have experienced longer waits, and many products are simply not available. We have learned that the global economy cannot simply be turned off and then flipped back on again with the expectation that it will come roaring back to life. This is especially the case when the threat of COVID-19 remains so high.
Returning to Normal?
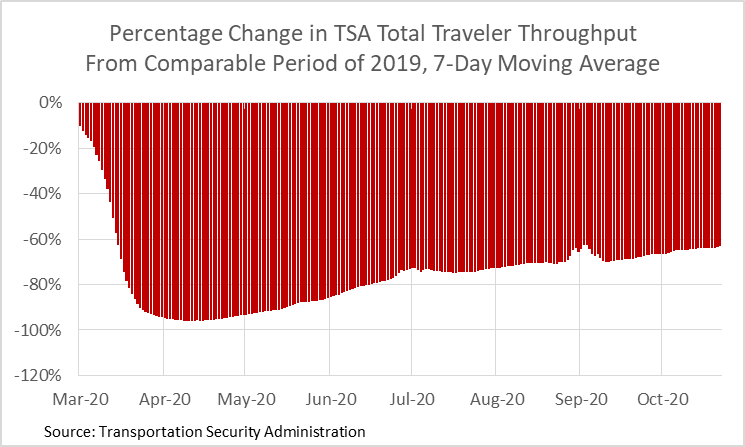
Even in areas where infection rates have been low, people remain cautious about events that require close contact with others. It took two years before air travel returned to normal following the 9/11 attack. It could take equally long for business which relies upon crowds of people to return to pre-recession levels following the COVID-19 pandemic, especially given that a vaccine has not yet been developed. As a result, while improving, economic activity remains far below anything considered “normal”. Passenger throughput at U.S. Airports for the seven days ending October 26, 2020, was 63.2% below the comparable year ago level. Recovery for this sector has been especially slow (see figure).
Consumer Spending Indicators
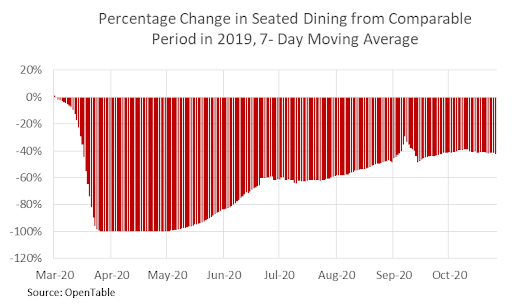
For the seven days ending October 26, Open Table reported seated dining averaged 42.4% below the comparable period of 2019. This level reflects a deterioration from that observed over the previous two weeks (see figure). The number of seated diners is falling as the number of new COVID-19 cases rise, giving support to the observation that the economic recovery has slowed since midsummer.
According to Opportunity Insights Economic Tracker, total debit and credit card spending by all consumers for the week ending October 11th was 3.7% below the average in January. Conditions have improved from previous weeks, but not all sectors are faring equally in the recovery. Debit and credit card spending on entertainment and recreation was 53.2% below the January average for the week ending October 11th. Spending on transportation was down 45.2%, and spending on restaurants and hotels was down 28.2%. On the other hand, spending on groceries was 11.3% above the January average, and general retail was up 8.6%. These trends are indicative of the uneven recovery we can expect going forward. Service sectors are likely to see much slower recovery than goods sectors, especially those that involve the gathering of crowds.
Debit and credit card spending by lower income consumers was up an average of 1.1% for the week ending October 11th, while spending by high income shoppers was down 7.2%. This trend is not surprising as low income consumers spend a greater share of their income on essentials which cannot be postponed.
Employment Trends
Interestingly, Opportunity Insights Economic Tracker also reports that employment in more affluent zip codes has nearly recovered from the Pandemic, down only 0.5% from the January average as of September 10, 2020. Employment among the bottom wage quartile, however, remains 19.9% below the January average. Curtailed spending by higher income individuals has led to strong job losses by low income individuals working in more affluent areas[2].
Context for the Recovery
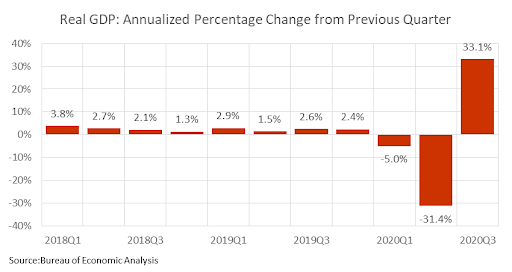
What do these trends mean for the economy? On October 29, 2020, BEA released their initial estimate for third quarter GDP which reflected an annualized 33.1% bounce over the second quarter. For comparison purposes the second quarter fell 31.4% from the first which was down 5% from the fourth (see figure). Third quarter real GDP was 2.9% below the third quarter of 2019. This initial estimate will be revised; and, in fact, BEA warns about quantifying the impact of the COVID-19 from the third quarter. But the basic story is likely to remain the same even after the data are revised – the economy is recovering but is not yet recovered from an exceedingly deep but relatively short recession.
Returning to Growth?
Don’t expect that robust growth of the third quarter to continue. In addition to the already mentioned lingering supply chain issues and continued risk from Covid-19, much of the growth in the third quarter was from unleashed pent-up demand which developed during the lockdown period. This demand will dissipate going forward. Growth was also bolstered by various stimulus programs which have ended.
Baring another widespread shutdown, growth in the fourth quarter will slow but remain positive. In fact, data are already showing a moderating but upward moving economy.
Growth Indicators
The Institute for Supply Management (ISM) offers indices measuring economic activity in the nation. There are two indices of particular note: the manufacturing index and the service index. Both indices combine multiple measures of industry level economic activity into a single index which is structured so that a value above 50% shows the industry in expansion while a value below 50% shows a contraction. Both series fell deep into contraction phase in April but have improved since. The Manufacturing Index for September was 55.4 percent. This was down slightly from the August number but still above 50, indicating an expansion. The Service index for September was 57.8% up slightly from August.
Employment Picture
Weekly Initial unemployment claims have likewise improved but remain elevated. After reaching a peak in mid-April of almost six million, the four-week average initial claims fell to 870,250 in the last week of September. As a point of reference, the number of people making requests for unemployment benefits for the same period in 2019 was 213,000.
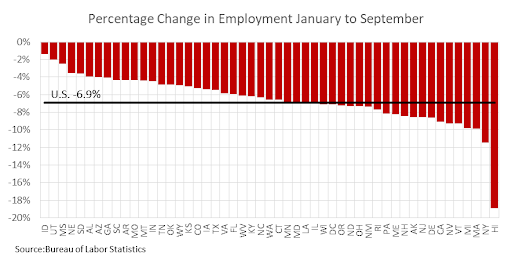
The Bureau of Labor Statistics reports a gain of 661,000 jobs in September over August. This was less than half of the job gains in the previous two months, again showing the moderation of the recovery. Despite five months of growth, the level of employment in September was 6.9% below the level of January. Among the states, Hawaii at -18.9% had the lowest percentage change in employment for the January to September period (see figure). Hawaii is especially reliant on tourism. New York was the second lowest at -11.5% followed by Maine at -9.9%. The state with the best performance was Idaho with a decline of only 1.4%. The state with the second highest job growth was Utah at -2.0% followed by Mississippi at -2.5%. The U.S. unemployment rate was 7.9% in September, down substantially from the 14.7% reached in April.
Looking beyond 2020, we expect the economy to make relatively steady improvement and reach full recovery by late 2021 or early 2022. The upside potential for growth will be greatly improved when a vaccine is developed. The largest downside risk remains further gains in the COVID-19 infection rate which leads to further government lockdowns.
Impact on Loan Losses Remain Uncertain
It remains to be seen how loan losses will be impacted by the COVID-19 recession but is something we will be monitoring closely. In previous recessions, particularly in 2008, charge-offs rose prior to the economy’s contraction and remained elevated even after recovery began. The abruptness and the self-inflicted nature of the 2020 recession means we should not have expected loan performance to deteriorate before the recession and, in fact, that appears to have been the case. Additionally, the tremendous government support during the shut-down, particularly though the Payroll Protection Program, has mitigated much of fallout, but this could be only temporary. The prolonged nature of the recovery suggests businesses will remain at risk, especially after this supply is depleted, and that means losses could still rise.
Total bank deposits at all institutions as of the second quarter of 2017, 2018, and 2019 averaged $13.5 trillion. As of the second quarter of 2020, the total was $17 trillion – 26% higher. This may be indicative of the shot of liquidity injected into the economy through the stimulus programs. While there has been talk of another stimulus, implementation has been thwarted by election year politics. It is possible some new stimulus effort will be passed after the election.
The election itself has introduced a degree of uncertainty. Uncertainty is not uncommon in elections years and, in fact, has risen in recent cycles when results have been close and outcomes not immediately known. Which party wins the White House probably has less of an impact on economic conditions than a protracted election decision. That is not to say the economy would be unaffected by the final outcome. The two parties have very different approaches to the economy. A Biden presidency would presumably roll back at least some of the tax cuts that have helped fuel growth in recent years, whereas another Trump term would continue these policies. However, prior to the COVID-19 Crisis, the Trump Administration’s trade policy was acting as a headwind for the economy which would not likely exist under a Biden Presidency. Biden would likely struggle to implement his tax proposal, and COVID-19 has made Trump’s trade war irrelevant. Any real impact from either presidency may not be felt over the next two years, especially if the economy continues to be shaped by COVID-19.
[1] GDP is the most comprehensive measure available of the overall value of the economy. “Real” just means it is adjusted for inflation.
[2] Opportunity Insights Economic Tracker, Affinity Solutions
How to cite this blog post (APA Style):
Premier Insights. (2020, November 3). Making Sense of the Current Economy – What to Expect [Blog post]. Retrieved from https://www.premierinsights.com/blog/making-sense-of-the-current-economy-what-to-expect.