
With respect to potential fair lending issues, redlining has remained a significant focus during regulatory examinations for a number of years. There are a number of critical pressure points that should accompany an institution’s self-evaluation of redlining risk. These points are broad and range from marketing efforts, products, branch locations, delineation of assessment and market areas, to underwriting policies and practices. Redlining risk and, consequently, a regulatory examination thereof can take many forms.
We will not try and cover all of these in this post, but instead intend to examine one aspect with respect to data analysis as a tool to gauge redlining risk. However, let’s first define our terms and consider an overview of redlining to provide some context.
What is Redlining?
The specific term “redlining” has actually evolved over time and is not specifically used in fair lending laws such as the Fair Housing Act or the Equal Credit Opportunity Act. The Interagency Fair Lending Examination Procedures (IFLEP) acknowledge this, but point out that courts and agencies have interpreted it as “ prohibiting institutions from having different marketing or lending practices for certain geographic areas” and where “the purpose or effect of such differences would be to discriminate on a prohibited basis.” The IFLEP define redlining as follows:
Traditional “redlining” is a form of illegal disparate treatment in which an institution provides unequal access to credit, or unequal terms of credit, because of the race, color, national origin, or other prohibited characteristic(s) of the residents of the area in which the credit seeker resides or will reside or in which the residential property to be mortgaged is located.
As noted above, the evaluation of potential redlining is very broad and can be analyzed from a number of differing perspectives. This is a key point lenders should be aware of, and it cannot be overstated.
The Procedures (IFLEP) define a broad scoping process in regard to evaluating redlining. In addition, examiners have a degree of discretion in how they approach fair lending examinations in general. It is, therefore, wise to bear in mind that redlining, as well as other fair lending issues, can be evaluated from a number of different angles.
Although redlining could be examined with regard to any prohibited base under fair lending laws, the IFLEP guidance focuses on race or national origin.
Redlining is Geographic
There are a few points of misunderstanding that sometimes arise with regard to redlining that warrant some clarification. The first is that the issue is in regard to geography rather than people. It IS in regard to people, however, indirectly so. For example, an evaluation may compare lending patterns in an area that is predominately white, non-Hispanic to an area that is predominately Hispanic. While the individuals in the area may be impacted, the comparison is on the aggregate of the activity in each respective area, not at the individual level.
Another area that deserves some clarification is at what geographic level is redlining evaluated? The answer is that it could be evaluated at a number of different geographic areas. This may include counties, cities, zip codes, or census tracts – essentially any geographic boundary in which proportions of prohibited base(s) compositions could be obtained.
For example, suppose a lender has locations in an MSA that has multiple counties, and these counties have different racial and/or ethnic compositions. Lending patterns may be examined at the county level. Similarly, an evaluation could be done at the census tract level. The latter is more common approach, and the one we will focus on here; but the point is the only geographic limitation may be the availability of data.
Redlining is a Fair Lending Issue
The concept of redlining is often confused with the Community Reinvestment Act (CRA). While there is overlap between the two, they are different things altogether. While the CRA may evaluate lending patterns based on the income levels of certain areas, the point of comparison for redlining involves prohibited bases as defined by fair lending laws. The income level of an area is not a prohibited base, and, therefore, comparing low-to-moderate income areas with other areas should not be confused with an examination of redlining. Again, the two may overlap, but they are not synonymous.
Recognizing Specific Risk Areas
Home Mortgage Disclosure Act data is often the focus in an evaluation of redlining, as it provides some convenient information. First, it allows comparisons to be done with other lenders, either in the aggregate or by selecting individual lenders. The HMDA data is reported at the census tract level, so comparisons can be made geographically to other lenders as to what an institution’s penetration may be based on racial and ethnic compositions.
Second, there is demographic data also included in the public files that can be used to classify geographies with respect to minority compositions. Historically, these data have been provided as a total minority percentage. The total minority population is defined as the total population less the non-Hispanic, white population. With the public data, therefore, a lender is able to examine at the census tract level, what their penetration may look like with regard to HMDA reportable lending compared to other lenders with respect to majority-minority geographies.
In a 2017 post we introduced the concept of specific protected classes that may be contained within the total minority composition figures, and how specific groups may need to be evaluated in addition to the total minority measure that has been historically provided with public HMDA data. This is becoming even more important as the nation continues to be more and more racially and ethnically diverse.
It is important to realize that an analysis based on total minority compositions may be significantly different than one that targets one or more specific racial or ethnic groups. Any specific group will represent a subset of the total minority composition figures provided with public HMDA data.
For example, if the analysis is examining tracts that are majority-minority based on a >50% threshold, targeting a specific group or groups may result in a different set of critical geographies than that based on the overall minority percentage. Hence, where the institution’s lending may appear consistent with peers based on the total minority composition as provided with the public data, it could look much different when limited to a subset of the overall minority tracts via limiting the >50% threshold to one particular racial or ethnic group.
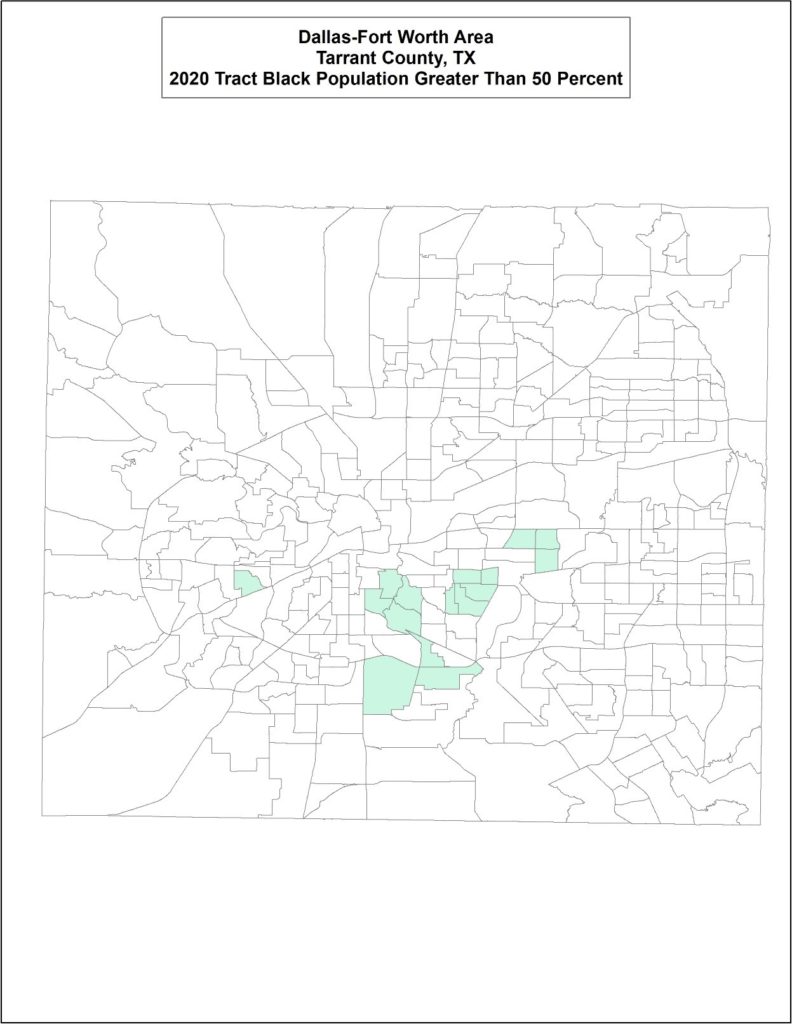
For illustration purpose, consider the maps below. The first map shows a portion of the Dallas-Fort Worth area with census tracts that are > 50% minority highlighted. As shown, there are a significant number of geographies that would be considered majority-minority based on the total minority population, comprised of all racial and ethnic minority groups.
![]()
Now consider the second map. The shaded tracts are tracts that are majority-black, or comprised tracts in which the black population alone comprises > 50% of the total population. The tracts highlighted on the second map are a subset of the tracts highlighted on the first map.
As can be seen, these are very different; and it easy to see how evaluation of only the total minority tract population could be an inadequate evaluation of risk. A lender may be performing well when based on the total minority population and not so well when looking at only one protected group. The reverse could also be true.
The above serve simply as examples, as the critical geographies could be much different when overlaying other specific racial or ethnic groups. And, this obviously could vary greatly depending on where an institution is located, and how different their service areas are. It is, therefore, significant that institutions understand their communities and be in tune to changes in the landscapes of their communities with regard to protected and non-protected groups.
In summation, (hopefully) the take-aways from this article are threefold: First, fair lending issues are broad, can be examined from a number of different angles, and redlining is no exception. We are just touching on one aspect here, but there are a many different pressure points with regard to redlining. A sense of this can be derived from reading the IFLEP and reviewing the approaches and the factors examiners are instructed to evaluate during such as review, a copy of which can be accessed online.
Second, it is critical for financial institutions to understand and know the communities they serve both demographically and geographically. Traditionally, this has not been an issue for community banks, as the ties to their communities were the lifeblood of their operations. While this remains largely true, expansion into new markets, mergers and acquisitions, and staff turnover can cause disruptions and create distance with respect to these ties. And, some areas from time-to-time experience rapid change which is not always apparent. It is a worthwhile endeavor for institutions to maintain their familiarity with the people and communities they serve.
Finally, redlining notwithstanding, a typical fair lending review or analysis involves members of specific protected and non-protected groups. Perhaps we should not expect for redlining to be any different. A geographic analysis of data based on a total minority calculation may be sufficient in regions in which there is only one dominant protected class. In regions where there is more diversity, it may not be. This is illustrated by the maps shown previously.
At the very least, it is a question that deserves an answer with regard to evaluating fair lending risk.
How to cite this blog post (APA Style):
Premier Insights. (2021, May 13). Redlining Risk & Data Analysis for Fair Lending in a Nutshell [Blog post]. Retrieved from https://www.premierinsights.com/blog/redlining-risk-data-analysis-for-fair-lending-in-a-nutshell.