The term “Information Age” probably pre-dates many who are reading this post, possibly originating as early as the 1970’s with the proliferation of computer technology. From the mainframe era, to PC’s, laptops, personal devices and smart phones, technology continues to shape our world at a seemingly ever increasing rate. This is all augmented by the connectivity provided by the internet and instantaneous access to information.
Information, and more specifically data, continues to be relied on across the spectrum for many purposes. An entire discipline, known as Data Science has emerged as new techniques are developed to extract, analyze, and make sense of the vast amount of data available. Such analyses now include not only complex modeling techniques but so called “machine learning” and artificial intelligence.
This reliance on data analytics has been very present in the regulatory landscape as well. Although emerging for some time, with regard to fair lending specifically, regression analysis has been employed heavily in the last 15 years both by regulatory and enforcement bodies as well as institutions.
We have become conditioned to rely on data analytics, which – in and of itself – is not a bad thing. Problems arise, however, when such reliance is accompanied by only a surface understanding of what the analytics mean and corresponding interpretations. This becomes even more problematic when this fact is unknown to the observer – simply, not knowing what one does not know.
There are a number of complexities with which to be familiar when it comes to fair lending analysis and regression. Below we focus on what is likely the main one.
This is the case for three reasons:
- it is a common problem
- it usually goes unrecognized or at best underappreciated
- it is largely misunderstood
In order to understand the main problem, some context is necessary.
First, in any fair lending analysis, whether it is statistical or otherwise, there is a presumption of causality. As it relates to statistical work in particular, we often bestow an even greater degree of reliability in terms of cause and effect. This is largely because there is perceived precise measurement and because there is a level of sophistication that tends to provide a level of authority to the results. There is, therefore, a tendency to take the results by themselves as conclusive.
But is this appropriate?
The answer, in terms of establishing a cause and effect relationship from a purely scientific perspective, is no.
The only research design methods that are able to truly establish cause and effect are experimental designs. A cross-sectional design – as is the case with the typical fair lending analysis – cannot establish causality. In fact, of all the design methods, although it may be the most common, the cross-sectional approach is the weakest of all empirically. Except for the “one shot” case study, in which only a single subject is evaluated without a comparator, it is the least robust method available.
When statistical methods are employed, we are observing correlation between variables. We call them variables because they vary (see how simple this is!).
For example, if income increases as persons get older, we would say income and age are correlated or move together. This makes sense. The data would likely bear this out, and there would likely be little disagreement over that point.
However, does getting older cause one’s income to go up? OR, do other things happen as one gets older that account for increases in income? Some people may get older and have little or no increase in their income, and others have big increases in their income as they get older. Increases in income, though correlated with age, are clearly the result of associated factors.
When two variables, say X and Y, are correlated, there are basically 4 possible explanations:
- X causes Y
- Y causes X
- the relationship is spurious
- OR it is just random chance
In our example, we can see the first two are not true. One could get older and not have more income, or one’s income could go up and they not be any older.
In other words, neither causes the other; they just tend to be correlated.
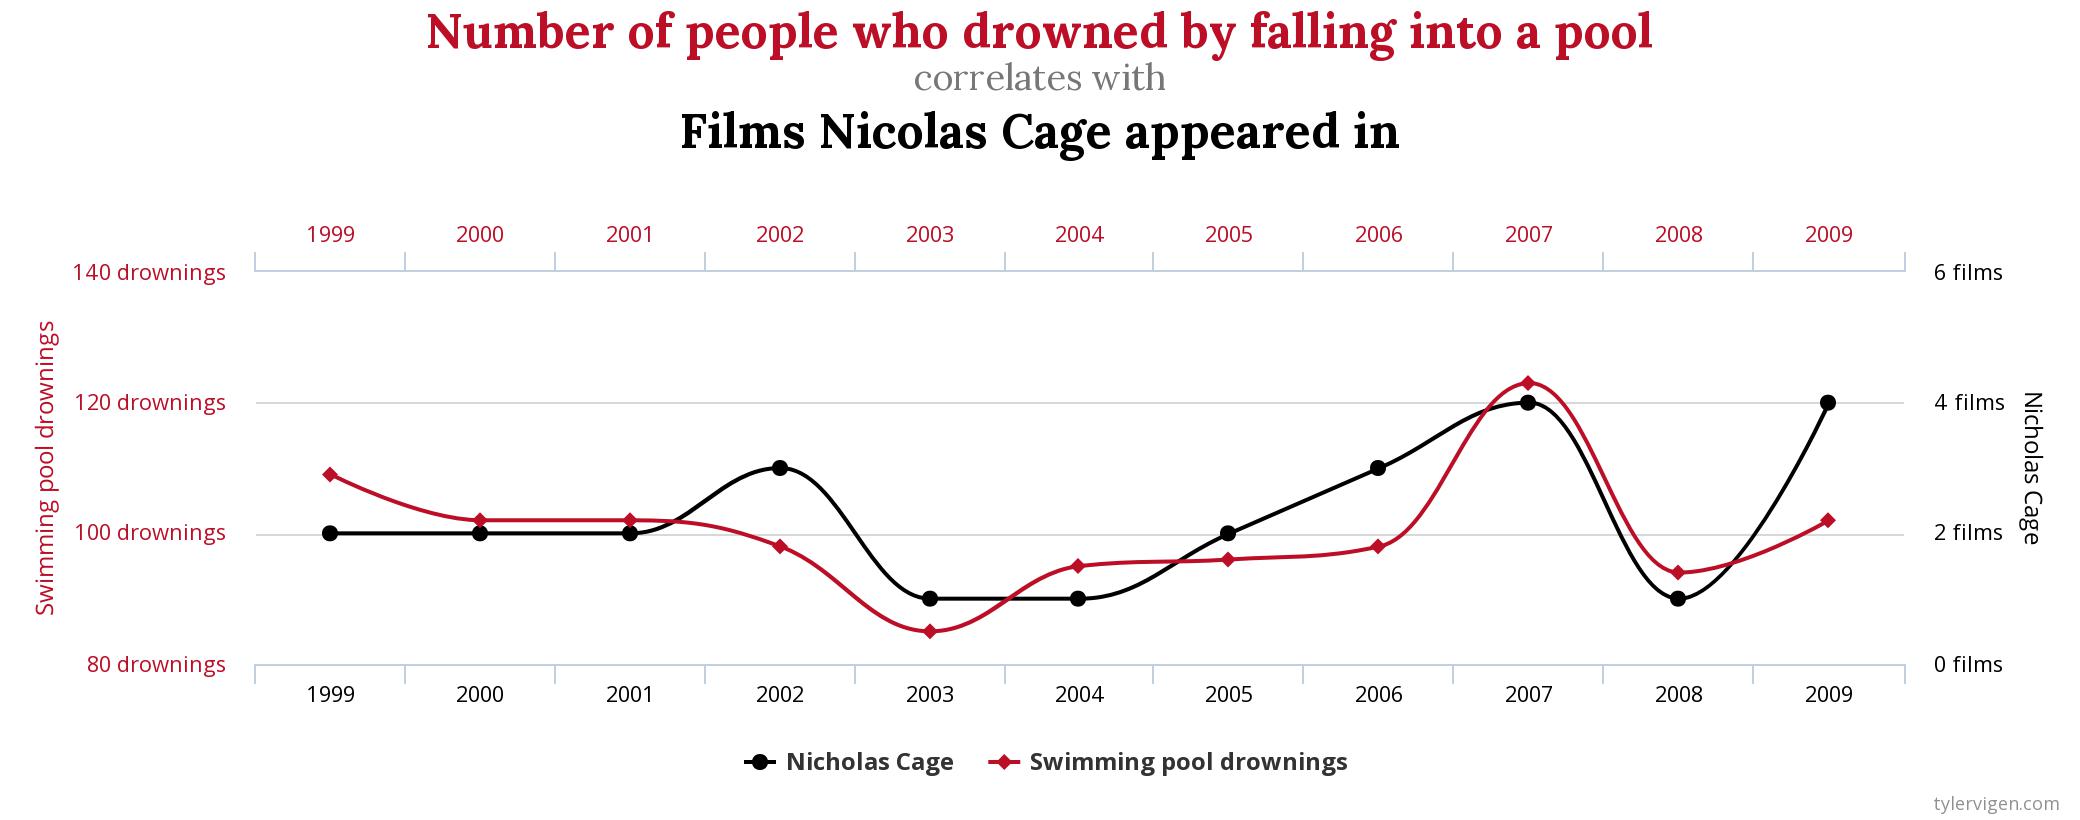
To really drive this point home with an absurd example, let’s take a look at an example from the fantastic “Spurious Correlations” website by Tyler Vigen.
Using data available from real, trusted sources, we find that there is a 66.6% correlation between the number of films Nicolas Cage appeared in and the number of people who drowned by falling into a pool. Seriously.
Correlation clearly does not, in fact, imply causation.
A Common Challenge
Hopefully, with the groundwork laid above, one of the main potential challenges in fair lending work is now becoming clear. And that is not only the inability to truly establish the causal link, but also ruling out alternative explanations as it relates to observed correlations.
For fair lending specifically, that pertains to treatment of applicants on the basis of race, gender, and ethnicity.
To illustrate, let’s begin with a simple graphical illustration of the simplest of regression equations, the bivariate model. Here we are interested in measuring the correlation of variable X with variable Y. In other words, how does Y change as X varies? The measure for X is shown on the horizontal axis on the bottom and the measure for Y is shown on the vertical axis on the left.

As shown above, there is a positive relationship between X and Y. As X increases, Y also increases. In a regression model, this “line” is what would we would be estimating based on the correlation between X and Y.
Looking at the points labeled on the graph, “a” is where the line starts, and “b” is the slope of the line or the expected change in Y for a change in X.
We could put this in an equation, which in this case would be y = a+bx. We know (a) as the starting point of the line as (b) as the slope, so we then could simply put in a value for x and get Y.
That Pesky Error Term!
There is one key piece left out of our illustration above as it relates to regression analysis. And that is the existence of the error term. In a regression equation, the “true” model is actually y = a + bx + e, where e is the error term, or the variation in y that is not explained by x. The error term contains the variation in the measurement variable that is unexplained by the variables in the model.
Why is this important? Because if the error term contains the effects of a variable left out of the model, and this factor is correlated with the measurement variable and a variable in the model, it may attribute its effect to a variable in the model with which it is correlated. It is not a variable directly included in the model, but it appears in the model by virtue of the error term.
In other words, it should be in the model, but because it is left out it can bias the results and produce erroneous results with respect to what IS included in the model. (See our article where we show a simulated example of such bias.)
Looking to a fair lending application as an example, let’s assume we are analyzing pricing as measured by the note rate charged on loans.
Assume that higher rates are charged to customers with lower credit scores, so we include that in our model. Our goal is to determine if Hispanic borrowers were charged different rates than non-Hispanic borrowers.
Now suppose the institution uses loan amount as well as credit score in loan pricing, but we fail to include this in the model.
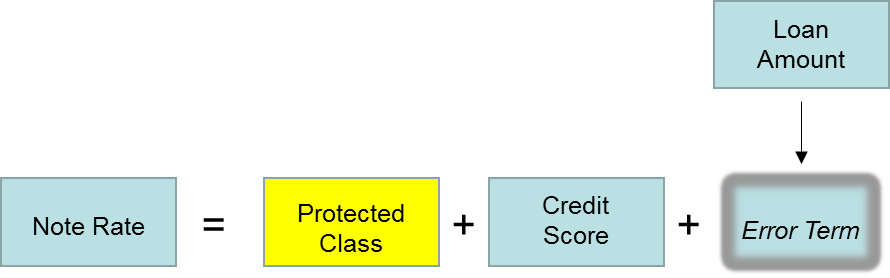
The model we estimate, therefore, only includes credit score along with whether the borrower was of Hispanic origin or not. The model will pickup the effect of credit score but not loan amount, meaning the effect of loan amount will become part of the error term.
If it turns out that loan amount is also correlated with Hispanic origin and rates to Hispanic borrowers differed due to loan amount, the effect will be attributed to Hispanic origin erroneously.
The graphic below illustrates this sequence.
True Model Should Be

Model We Estimate When Loan Amount Left Out
Why This is Critical in Fair Lending
The previous example has been greatly simplified for illustrative purposes. In practice, it is rarely this simple.
While there are occasions where we know the full range of factors that are influential in conducting an evaluation, the more common issue is data availability.
Loan decisioning in particular can be quite complex with a lot of moving parts combined with changes over time. There is also product variation and an almost infinite number of unique situations that can be impactful. These types of data are typically not available to be included in these types of analyses.
Application
Regression and other forms of statistical analysis are part of a toolkit to be used in evaluating fair lending risk and performance. It also largely goes unrecognized, but there is a good bit of subjectivity in statistical analysis.
One reason many people cringe when they think about statistics classes they took in school is due to the abstract aspects. There are often a number of differing techniques that can be used for the same situation. Thankfully, many times differences in approaches yield similar results. However, sometimes they may not; and because situations can vary so much, there is seldom a rulebook that suggests what the right answer is. And, we are always at the mercy of limitations of the data available.
Fortunately, half the battle is recognition and an appreciation and understanding of the methods employed. An accordingly structured analysis strategy combined with any needed qualifications of results will keep these challenges from becoming problems.
How to cite this blog post (APA Style):
Premier Insights. (2020, June 11). Challenges in Fair Lending Analysis, or Why You Don’t Have to Avoid Swimming Pools When Nicolas Cage is Working [Blog post]. Retrieved from https://www.premierinsights.com/blog/challenges-in-fair-lending-analysis-or-why-you-dont-have-to-avoid-swimming-pools-when-nicolas-cage-is-working.